Bitcoin adoption in 2015
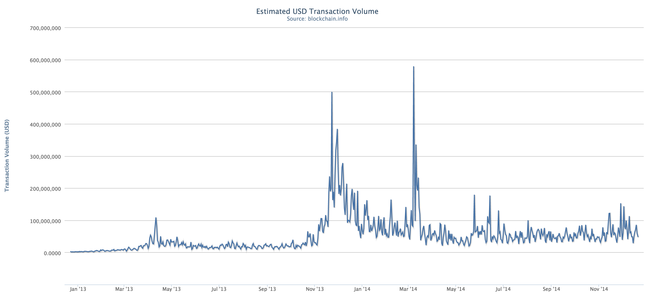
The chart related to bitcoin that I find most interesting is not price, but instead Estimated USD Transaction Volume from Blockchain.info:

The reason I find this chart useful is that it seems a decent proxy for the amount of value being transacted through the network irrespective of bitcoin price fluctuations.
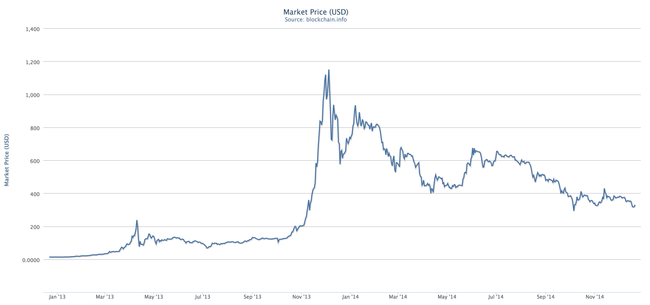
By way of comparison, here is a chart of the USD market price of bitcoin over the same period:

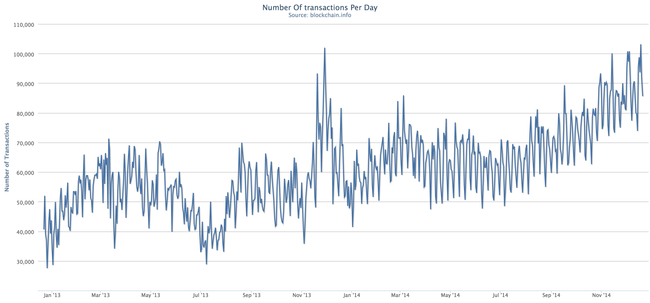
And here is a chart of the number of daily transactions over the same time period:

Taking these three charts together, the relatively static USD transaction value per day metric in 2014 appears to be the result of the falling market price of bitcoin being offset by increased transaction volume.
Perhaps this is all just a coincidence, but it appears that 2014 was a year of relatively static demand for transacting value through bitcoin. Static demand implies that either 1) the...
